Analyse a FB Messenger group chat with Matlab
I’ve recently created a short Matlab script to easily plot some metrics of group chats. I have a group chat with some friends used purely to debate about basically anything so I thought it could be a good idea to analyze each member’s contributions during the group’s 6 month lifespan. I chose Matlab because I’m already used to it, and I am way worse with any other language. This script automatically creates 4 types of charts: percentage of types of message (for each member), average words per message per person, number of messages sent per member, and messages sent by date. The script also saves into a structure, for each member, the total number of words sent, average words sent per message and a table with all the messages sent.
Download your group chat
This script works with Facebook Messenger groups. You can download all your FB chats in Settings>Your FB information>Download your information then select only messages and choose the time period and select json as format. I then used an online json to csv converter(https://www.convertcsv.com/json-to-csv.htm). Before the conversion, the json file requires some modifications.
The selection shown in the figure below should be erased (remember to erase the last bracket of the file too):
This csv file can now imported into Matlab and be saved as a .mat table. This way the file can automatically be opened by the script (chat.mat).
Figures produced
Type of message pie chart
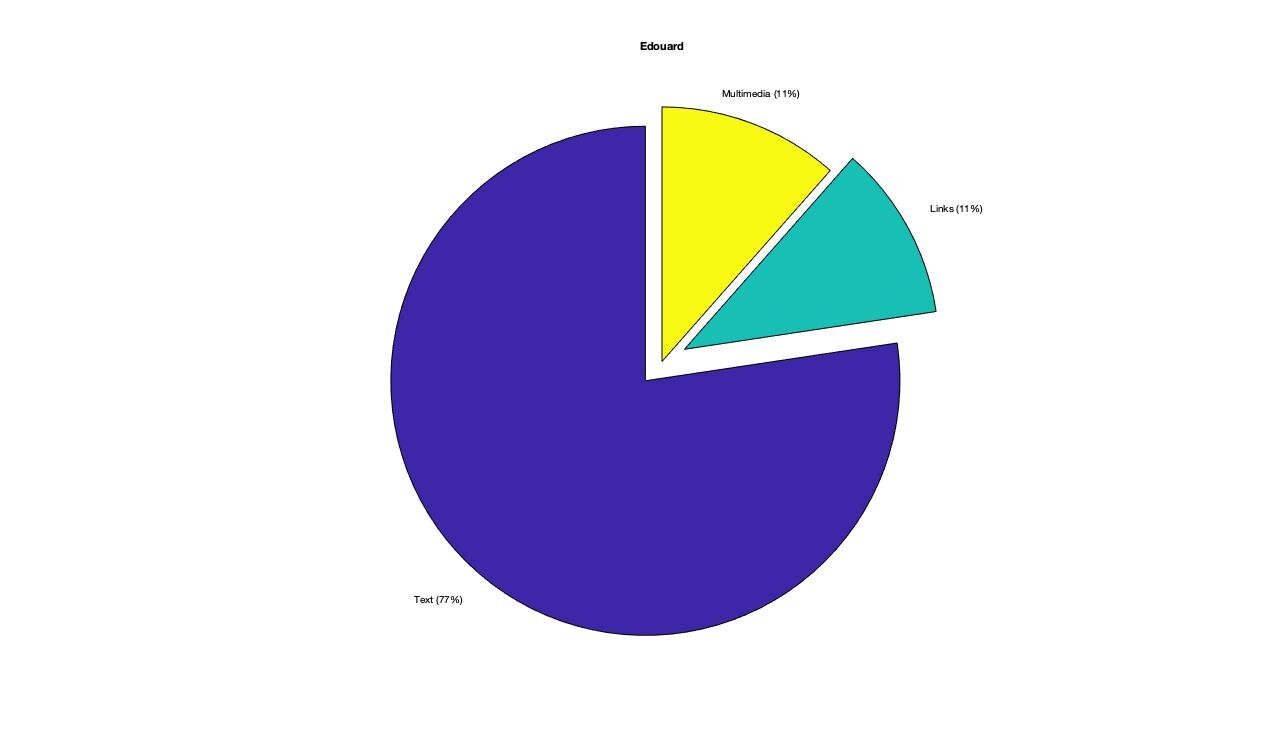
A pie chart specifying the percentage of message types sent is created for each group member. The different message types are text, multimedia and Links.
Text category includes all messages containing only text
Links category includes messages containing links. Messages containing both text and links belong to this category.
Multimedia category includes images, videos and files sent.
Links and multimedia messages are often used to spark new debate topics whereas text messages are used more often to explain arguments. So these charts can help understand who is debates more and who tends more to propose new conversations. Of course this is not an exact metric as multimedia are sometimes also used as prove to confirm or deny someone’s argument.
Average word count per message
This figure is very interesting as it lets us compare the average number of words sent per message of each member. This data is also stored by the script into the “personal” structure which contains member-specific data. In our case, the average message length in our group is 13,4 words. In my opinion, a correlation can probably be drawn between message length and “intellectual value” of the message.
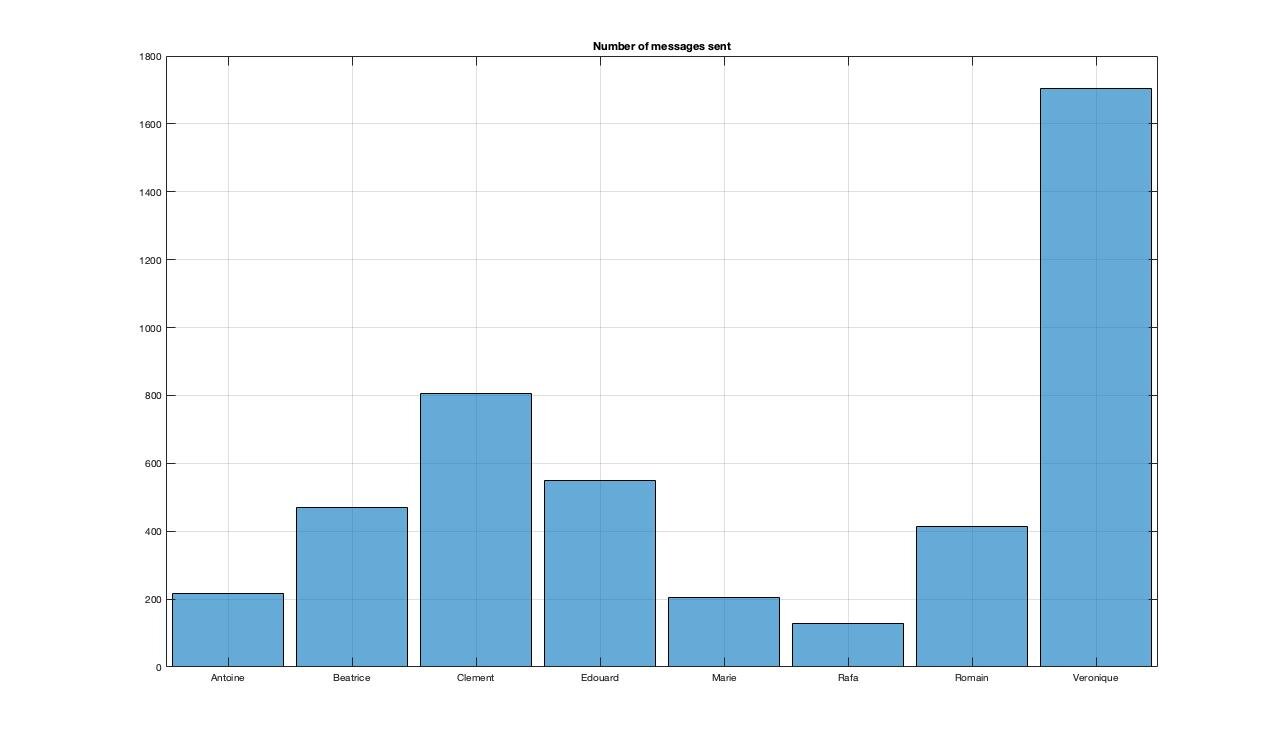
Total messages sent
This histogram is, in my opinion, useful to determine each member’s commitment to the group. The only purpose of the group is to debate, not planning activities or trips for the weekend. Therefore, I believe that commitment to the group can be correlated to the amount of messages sent. In normal friend group chats, commitment to the group is much less dependent on this metric (again, in my opinion) since the goal of a normal group is not to argue via text messages but build and maintain social interactions (both inside AND outside the group chat).
Messages sent per day
This chronological histogram displays the total number of messages sent per day. Not much else to say, you can try to link the spikes in activity to different news events.
Conclusion
Coding this short script and sharing the results with friends has been a fun way to analyze and better understand the general behavior of the group and each of its members. Many functionalities can still be added to this code.
So, if you want to play with my script, I’ve left a download link at the bottom. I have tried to make it understandable with some comments. Do not hesitate to contact me for any doubt regarding the script.


